Growth plan for Kettle & Fire, 1 Oct 2026
Scale spend. Hold CAC.
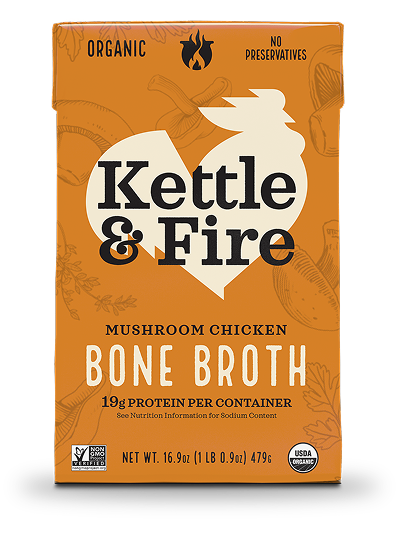
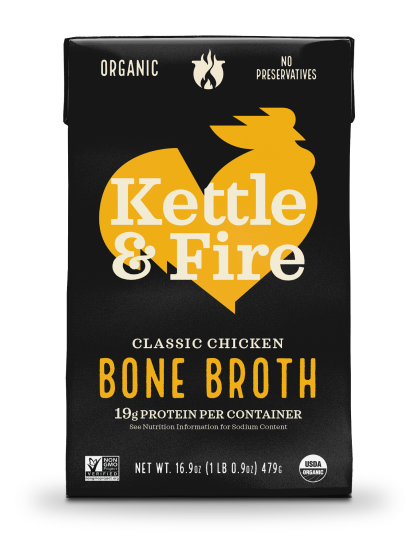
The brand already has 7,462 Reviews on one page and an $8.49 carton to lead with. The plan turns that proof into creator ads tested one variable at a time, and holds one number: a target CAC of $24.48.
- Target CAC
- $24.48
- New ads a week at peak
- 20
- Creators live by week six
- 10
- Test spend, six weeks
- $24,000
Contents
10 chapters, then the gates and every number’s source.
01 The number
One number to protect: $24.48 CAC on an $8.49 carton
The number is a target CAC of $24.48. It is 0.6 of the $40.80 ceiling, which comes from a $51 average order, a 40% margin and one repeat order. Order value and margin are my inputs until week one replaces them with yours.
Protect
Target CAC: $24.48 on a first purchase
Ceiling = average order × margin × (1 + repeat orders): $51 × 40% × (1 + 1) = $40.80. Guard line = 0.6 × $40.80 = $24.48. Across the ranges: $0.11 to $290.25.
Three moves
- Kill losing ads early, so spend moves only to ads that hold under $24.48.
- Test one offer per ad: free shipping at 12+ cartons or 20% off for subscribers, never both in the same test.
- Report daily CAC against the guard line, so any drift shows up the same day it starts.
- Reviews shown on one page
- 7,462
- Published
- cartons for free shipping
- 12+
- Published
- off for life for subscribers
- 20%
- Published
02 Variety
Every ad carries one reason: grass-fed, simmer time, or the offer
Each concept carries one reason to buy: grass-fed and grass-finished bones, a simmer of 20+ hours, a flavor like Thai Coconut Curry Chicken, or an offer such as 10% off your first order. One reason per ad keeps the test readable.
| Reason to buy | Proof you already have | Ads (proposed) |
|---|---|---|
| Slow-simmered | Simmered for 20+ hours | 5 |
| Global flavors | Mouthwatering miso & zesty ginger come together in a savory broth, perfect for sipping or cooking. | 5 |
| 100% grass-fed bones | Made with bones from 100% grass-fed and grass-finished cattle | 2 |
| Thousands of reviews | 7,462 Reviews | 2 |
| Subscriber discount | Subscribers receive a special 20% discount on every order. | 2 |
| Full flavor, less sodium | Full flavor, less sodium. We didn’t lower our standards, just sodium. | 1 |
| Free shipping on cartons | FREE SHIPPING ON 12+ CARTONS | 1 |
| Total | The ad concepts tab | 18 |
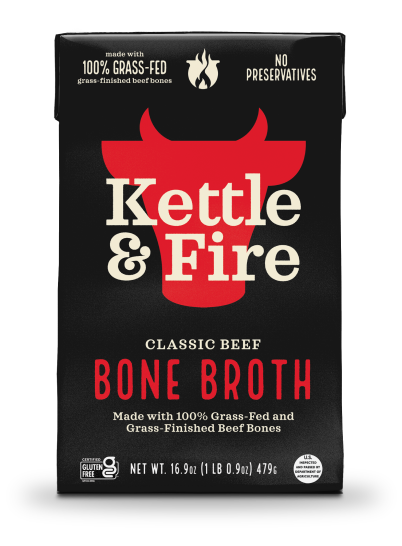
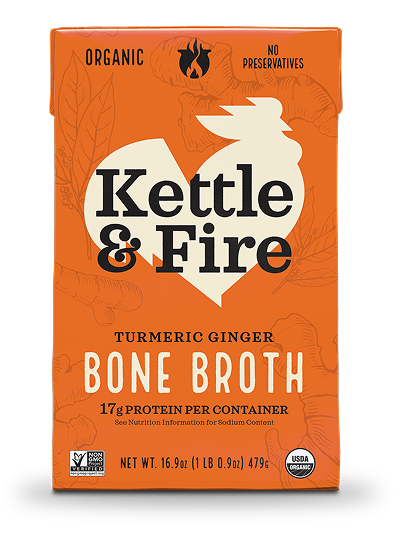
Each row is a reason to buy that the brand already has proof for. The count is how many of the ads carry it: a reason with a single ad is a bet, not a pattern, and the next batch of concepts moves toward the reasons that win.
03 Disturbances
Seven risks, led by a free-shipping rule that reads two ways
| Disturbance | Likelihood | Impact | Owner | Gate (proposed) |
|---|---|---|---|---|
| Free shipping reads 12+ cartons in one place and 6 or more units in another | High | High | Your team | One shipping message per landing page before any ad using it goes live |
| The 20% off for life ask lowers first-order conversion for cold traffic | Med | High | Both | Pause the subscription-led ad if its CAC stays above $40.80 after one week |
| Health wording on the Immunity Bundle 12-Pack drifts beyond the brand's own words | Med | High | Me | Every script checked against the claims sheet before posting; zero unchecked posts |
| Average order and margin are guesses, so the $40.80 ceiling could be wrong | High | High | Your team | Real order value and margin received before the first test week starts |
| Creator output slips below the planned 14 videos a week at the start | Med | Med | Me | First two creators post 14 videos a week combined, or I replace one |
| Tracking gaps hide which ad drives subscription starts | Med | High | Both | Purchase and subscribe events firing on every landing page before spend passes $3,000 |
| Venison and Bison at $8.99 cost more than the $8.49 core flavors and weaken first orders | Low | Low | Me | Lead with $8.49 flavors; $8.99 flavors only after a core ad holds under $24.48 |
Scores are my read from outside the company, re-scored in week one with your data. Each risk has one owner and one gate that can be checked with a number, so nobody has to argue about whether it happened.
04 The ceiling
The ceiling is $40.80, and the $51 order value is a guess
| Line | Value | Status |
|---|---|---|
| Average order | $51 (range $0.21–$215.00) | Assumption Range from the site product prices (Published); the midpoint is a guess |
| Gross margin | 40% (range 35–45%) | Assumption Replace in week one |
| Repeat orders after the first | 1 (range 0.5–2) | Assumption Replace with cohort data in week one |
| Margin per customer, all orders | $40.80 | Calculated Average order × margin × (1 + repeat orders) |
| Guard line for CAC | $24.48 | Calculated 0.6 × the margin per customer |
The math, with the assumed lines
Ceiling = average order × margin × (1 + repeat orders): $51 × 40% × (1 + 1) = $40.80. Guard line = 0.6 × $40.80 = $24.48. Across the ranges: $0.11 to $290.25.
Range across the assumptions: $0 to $290.
The $51 order, 40% margin and one repeat order are inputs I propose, not facts. The $40.80 ceiling and $24.48 guard line move when week one swaps in your real numbers.
The ceiling is a range, not one number: the most a new customer can cost before shipping and packaging, which I do not have. Replace the guessed lines with yours and every figure below recalculates.
05 Test ramp
Six weeks, $24,000 of tests, before any scale decision
| Week | New ads × budget / ad (proposed) | Weekly test spend | Cumulative | Creators posting | CAC target (proposed) |
|---|---|---|---|---|---|
| 1 | 12 × $250 | $3,000 | $3,000 | 0 | $24 |
| 2 | 12 × $250 | $3,000 | $6,000 | 2 | $24 |
| 3 | 12–20 × $250 | $4,000 | $10,000 | 4 | $24 |
| 4 | 12–20 × $250 | $4,000 | $14,000 | 6 | $24 |
| 5 | 20 × $250 | $5,000 | $19,000 | 8 | $24 |
| 6 | 20 × $250 | $5,000 | $24,000 | 10 | $24 |
Six weeks of tests: $3,000 in week one and week two, $4,000 in weeks three and four, $5,000 in weeks five and six, $24,000 in total. New ads rise from 12 to 20 a week as creators come on. All Proposed.
The math. Week 1: 12 × $250 = $3,000; Week 2: 12 × $250 = $3,000; Week 3: 16 × $250 = $4,000; Week 4: 16 × $250 = $4,000; Week 5: 20 × $250 = $5,000; Week 6: 20 × $250 = $5,000. Total $24,000 (96 ads × $250). A range such as 12–20 counts as its midpoint.
Weeks one and two test what the brand already has, rewritten per reason to buy. From week three, creator videos enter paid only after they beat their own account median. A range of new ads counts as its midpoint in the spend column.
06 Volume
More concepts, more winners: 20 to 80 concepts a month
More concepts, more winners: 20 concepts give 2 winners, 80 give 8. Hit rate and spend per winner are Assumption figures, so I report them weekly and replace them with real ones.
| Concepts tested / month | Hit rate (assumed) | New winners / month | Spend each winner holds (assumed) | Added spend at target CAC |
|---|---|---|---|---|
| 20 | 10% | 2 | $300 / day | $18,000 / month |
| 40 | 10% | 4 | $300 / day | $36,000 / month |
| 60 | 10% | 6 | $300 / day | $54,000 / month |
| 80 | 10% | 8 | $300 / day | $72,000 / month |
The math. 20 concepts × 10% = 2 winners × $300 × 30 days = $18,000 a month; 40 concepts × 10% = 4 winners × $300 × 30 days = $36,000 a month; 60 concepts × 10% = 6 winners × $300 × 30 days = $54,000 a month; 80 concepts × 10% = 8 winners × $300 × 30 days = $72,000 a month.
The hit rate and the spend each winner holds are placeholders. The first thirty days of tests replace them with real numbers, and the table is recalculated the same day.
07 Allocation
Where the $100,000 goes: tests first, winners next
- Creator ads in test
- $45,000
- 45%
- Winners scaled on Meta
- $30,000
- 30%
- Landing pages and offer tests
- $15,000
- 15%
- Reserve for the best second channel
- $10,000
- 10%
This is how I propose to split the $100,000 budget; the shares move once week one shows which ads hold under $24.48.
The math. 45% × $100,000 = $45,000; 30% × $100,000 = $30,000; 15% × $100,000 = $15,000; 10% × $100,000 = $10,000. Sum 100% = $100,000.
This split is a proposal. It moves toward scaling as winners prove out, and toward testing when fatigue shows.
08 Channels
Meta first; Amazon and Whole Foods limit what we can measure
| Channel | Open when (proposed) | Why wait |
|---|---|---|
| Meta | Week one, with the first creator ads | Creator video fits an $8.49 carton and a clear offer; it is where the tests run |
| TikTok | When a Meta concept holds under $24.48 | Same creator videos, cut for a feed built on food and cooking content |
| Email and SMS | Once first orders are tracked by offer | Repeat orders and subscription starts feed the payback rule |
| Amazon and Whole Foods | Only after the site CAC holds | The brand also sells there, so site ads can lift sales I cannot measure |
| Search | When ads lift brand demand | Captures people who saw a creator video and then look for the brand by name |
A channel opens when its condition is true, not when the calendar says so. Until then the budget stays where the CAC is earned.
09 Payback
A $45 CAC never pays back, so spend stops there
Payback is the real constraint. Under the PLAN rule, a $10 CAC pays back on the first order with $30.80 left; $25 pays back after repeat orders with $15.80 left; $45 and $55 never pay back. I cut spend at any CAC that never does.
Cumulative margin per customer, order by order, before CAC: $20.40, $40.80.
| CAC (scenario) | First-order margin | Year-one margin | Left after CAC | Payback |
|---|---|---|---|---|
| $10 | $20.40 | $40.80 | $30.80 | First order |
| $25 | $20.40 | $40.80 | $15.80 | After repeat orders |
| $45 | $20.40 | $40.80 | −$4.20 | Never: stop |
| $55 | $20.40 | $40.80 | −$14.20 | Never: stop |
The math. CAC $10: $40.80 − $10 = $30.80 left; pays back: First order; CAC $25: $40.80 − $25 = $15.80 left; pays back: After repeat orders; CAC $45: $40.80 − $45 = −$4.20 left; pays back: Never: stop; CAC $55: $40.80 − $55 = −$14.20 left; pays back: Never: stop.
Read each row left to right: the margin of the first purchase, the margin over the whole horizon, what is left after CAC, and the purchase on which the CAC is earned back. A scenario that never pays back is a stop, not a test.
10 Scope
Scope: I run ads and creators; the 20% subscriber offer stays yours
Covers
- Meta and TikTok creative testing, one variable per test
- Creator sourcing, briefs and weekly video output
- Landing page copy for each tested offer
- Daily CAC, weekly learnings, monthly cohort payback
Doesn’t
- Event tracking build: I spec it, your team ships it
- Fulfillment, shipping rules and the 12+ carton threshold
- Amazon and Whole Foods listings
- Product, flavors and pricing decisions
What this plan covers is what I can change inside the ad account and the creator program. Everything outside it is named on the right so nobody assumes it is handled.
Gates, written before spend, so stopping isn’t a negotiation.
| Day | Keep going if (proposed) | Stop or change if |
|---|---|---|
| Day 14 | Tracking fires on purchase and subscribe; daily CAC is visible; first ads spent against the $3,000 week-one plan | Tracking still broken, so CAC cannot be read |
| Day 30 | At least one concept holds CAC at or under $24.48 across the first tests | No concept under $40.80 after $14,000 of tests |
| Day 60 | Winners scale while blended CAC stays at or under $24.48 and payback lands inside repeat orders | CAC above $40.80 for two weeks straight |
| Day 90 | Scaled spend holds target CAC and the cohort pays back after repeat orders | Cohort payback reads never at the current CAC |
Each gate is checked on its day with the numbers in the daily and weekly reports. If the stop condition is true, the spend stops and nothing renews until we talk.
What exists, what’s missing, and the order that’s forced.
| Piece | Exists today | Missing | Forced order |
|---|---|---|---|
| claims sheet | Own wording: grass-fed and grass-finished, simmered for 20+ hours | One sheet every creator script is checked against | Week 1 |
| creative | Review counts up to 7,462 and flavors from $8.49 | A hook library built on one variable per test | 1st |
| creators | Flavors with a story, like Maui Nui Venison at $8.99 | A roster and briefs by persona | 2nd |
| landing pages | Variety 6 Pack at $49.44 with free shipping on 6 or more units | One shipping message and one offer per page | 2nd |
| reporting | Subscribe & save 20% as the repeat-order lever | Daily CAC sheet and the event tracking spec | Week 1 |
The order is forced on purpose: creative and creators come first because they are what moves CAC, and everything else waits for that data.
Every number, and where it came from.
| Figure | Where it came from | Type |
|---|---|---|
| 7,462 Reviews shown on one page | https://www.kettleandfire.com/ | Fact |
| 12+ cartons for free shipping | https://www.kettleandfire.com/ | Fact |
| 20% off for life for subscribers | https://www.kettleandfire.com/pages/store-locator | Fact |
| Product prices $0.21–$215.00 | product prices in the site product data (98 products), read 2026-10-01 | Fact |
| $51 average order · 40% margin · 1 repeat order | Placeholders, replaced in week one | Assumed |
| $24.48 target CAC | 0.6 of the $40.80 margin per customer | Calculated |
| $40.80 margin per customer | Price × (margin − discount), summed over the orders | Calculated |
| $24,000 of tests (96 ads × $250) | Danilo’s plan, matches Month one | Calculated |
| 0→10 creators in 6 weeks · 7 videos per creator a week | Danilo’s plan, matches Month one and the Creator engine | Proposed |
| $100,000 first budget split 45% / 30% / 15% / 10% | Danilo’s plan, re-set with the team in week one | Calculated |
| 10% hit rate · $300 a day per winner | Placeholders, replaced by the first 30 days of tests | Assumed |
| 303 creator videos a month at 10 creators | 10 creators × 7 videos a week × 52 ÷ 12 | Calculated |
| $5.74 per 1,000 views against a $1 target | Creator cost over the views the assumptions give | Calculated |
| $1,000 base pay · $50 bonus past 100,000 views | Danilo’s plan | Proposed |
| 1,500 median views · 4% breakout (10×) · 0.5% viral (750,000) | Placeholders, replaced by the first month of posts | Assumed |
| Pay bands $300–$600, $500–$1,000, $800–$1,500 | Danilo’s plan | Proposed |
Every figure on this page is listed here with where it came from. Fact means read on the site. Assumed and Proposed are Danilo’s own numbers, to be replaced in week one. Calculated is plain arithmetic on those, with the formula shown next to it.
Month one is where it starts.
Week one: I get your real order value and margin, build the claims sheet from your own wording, brief the first creators and launch twelve ads, with $3,000 of tests behind them. Daily CAC starts that day.